廬
APPLICATION BULLETIN
Mailing Address: PO Box 11400 鈥?Tucson, AZ 85734 鈥?Street Address: 6730 S. Tucson Blvd. 鈥?Tucson, AZ 85706
Tel: (520) 746-1111 鈥?Twx: 910-952-111 鈥?Telex: 066-6491 鈥?FAX (520) 889-1510 鈥?Immediate Product Info: (800) 548-6132
DYNAMIC TESTS FOR A/D CONVERTER PERFORMANCE
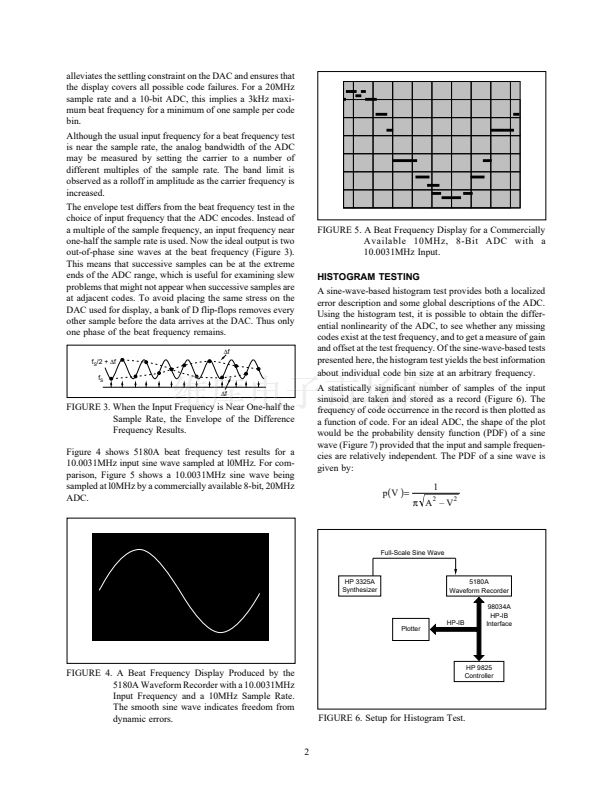
This article describes useful theory and techniques for evalu-
ating the dynamic performance of A/D converters. Four
techniques are discussed: (1) beat frequency, (2) histogram
analysis, (3) sine wave curve fitting, and (4) discrete finite
Fourier transform.
The key to confidence in the quality of a waveform recorder
is assurance that the analog-to-digital converter (ADC) en-
codes the signal without degrading it. Dynamic tests that
cover the frequency range over which the converter is
expected to operate can provide that assurance. The results
of the dynamic tests give the user a model of resolution
versus frequency for the recorder. More elaborate models of
failure mechanisms can be obtained by varying the condi-
tions of the tests.
All of the dynamic tests used for the 5180A Waveform
Recorder use sine waves as stimulus. Sine waves were
chosen primarily because they are the easiest to generate in
practice at the frequencies of interest with adequate fidelity.
While it may be possible to generate a square wave, for
example, whose function is known to the 10-bit resolution of
the 5180A, no square wave generators exist that can guaran-
tee the same waveshape to 10-bit resolution at 10MHz from
unit to unit. Another motivation for choosing a sine wave
stimulus is the simple mathematical model a sine function
provides for analysis. This benefit greatly simplifies the
algorithms used for data analysis.
Four dynamic tests for waveform recorder characterizations
are presented here: beat frequency testing
(1)
histogram analy-
sis
(2)
sine wave curve fitting,
(3,4)
and discrete finite Fourier
transform.
(5)
The last three tests operate in the same way. A
sine wave source is supplied to the waveform recorder and
one or more records of data are taken. A computer is then
used to analyze the data. The tests differ primarily in the
analysis algorithms and consequently in the sort of errors
brought to light. Critical to the success of these tests is the
purity of the sine wave source. Synthesized sources are
necessary to provide the short-term and long-term stability
required by the dynamic range of the ADC. Passive filters (a
six-pole elliptical filter is used for 5180A tests) are required
to eliminate harmonic distortion from the source.
These tests provide the most stressful conditions for the
ADC with the input signal amplitude at full scale. Generally
speaking, nonlinear effects increase more quickly than the
signal level increases because of the nonideal large-signal
DC behavior of the ADC components and the higher slew
rates large amplitudes imply.
漏
BEAT FREQUENCY TESTING
The beat frequency and envelope tests are qualitative tests
that provide a quick, simple visual demonstration of ADC
dynamic failures. An input frequency is selected that pro-
vides worst-case range changes and maximal input slew
rates that the ADC is expected to see in use. The output is
then viewed on a display in real time.
Waveform Recorder
Under Test
Memory
HP 3320A
Synthesizer
ADC
f
s
f
s
+
鈭唂
Input
Time Base
DAC
CRT
(Playback)
FIGURE 1. Beat Frequency Test Setup.
鈭唂
f
S
+
鈭唂
f
S
FIGURE 2. When the Input Frequency is Close to the Sample
Rate f
S
, the Encoded Result is Aliased to the
Difference or Beat Frequency,
鈭唂.
The name 鈥渂eat frequency鈥?describes the reasoning behind
the test. The input sinusoid is chosen to be a multiple of the
sample frequency plus a small incremental frequency (Fig-
ure 1). Successive samples of the waveform step slowly
through the sine wave as a function of the small difference
or beat frequency (Figure 2). Ideally, the multiplicative
properties of sampling would yield a sine wave of the beat
frequency displayed on the waveform recorder鈥檚 CRT. Er-
rors can be seen as deviations from a smooth sine function.
Missing codes, for example, appear as local discontinuities
in the sine wave. The oversize codes that accompany miss-
ing codes are seen as widening in the individual codes
appearing on the sine wave. By choosing an arbitrarily low
beat frequency, a slow accurate DAC may be used for
viewing the test output. For best results, the upper limit on
the beat frequency choice is set by the speed with which the
beat frequency walks through the codes. It is desirable to
have one or more successive samples at each code. This
))))Burr-Brown Corporation
AB-072
1
Printed in U.S.A. Month, Year


 1
1
 2
2
 3
3
 4
4
 5
5
 6
6
 7
7
 8
8
 9
9
